
Xero
Xero organisations with GBP, EUR or USD as their base currency.
Explore Xero reportingFor owners and group finance staff
Connect Xero, QuickBooks Online and FreeAgent companies and compare their saved financial reports. Review account mappings before using a common reporting chart across your group.
Watch the existing 84-second product tour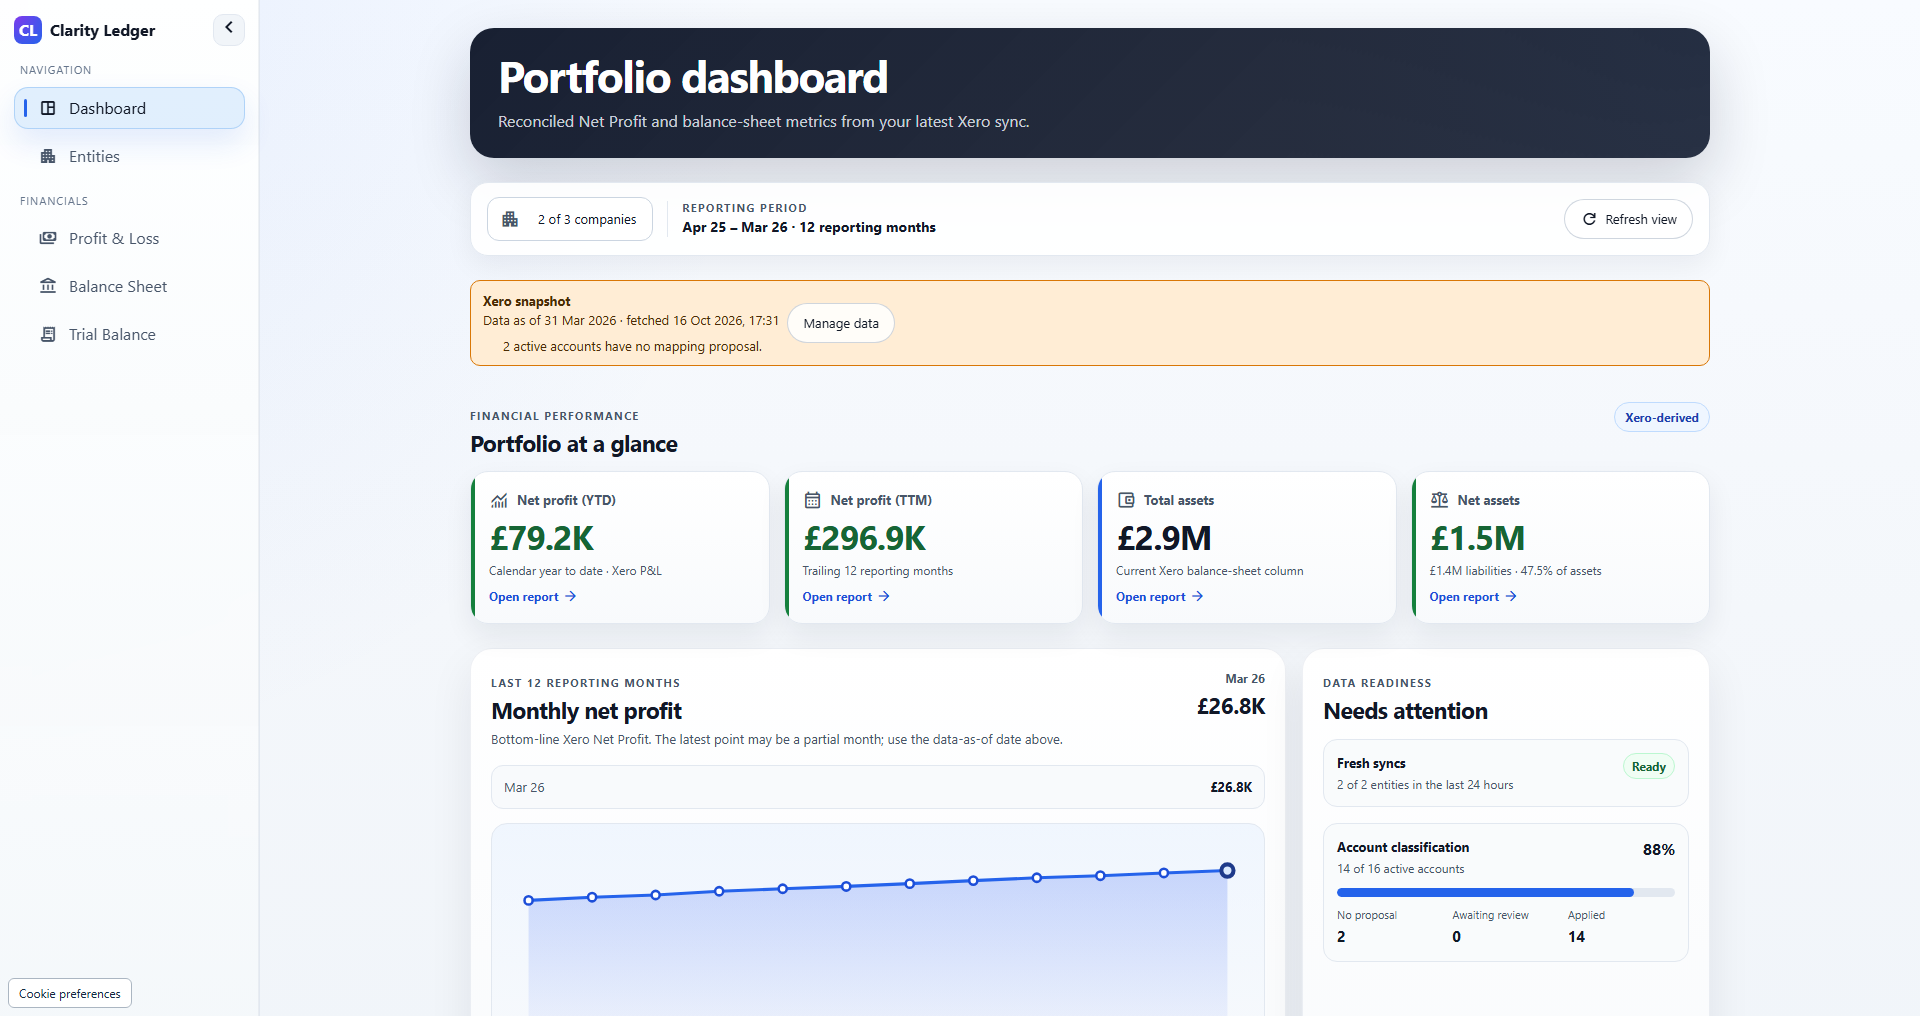
Keep your accounting platforms
Connect each company through its accounting provider. Use saved financial reports and reviewed mappings to compare companies in the same workspace.
Xero organisations with GBP, EUR or USD as their base currency.
Explore Xero reportingQuickBooks Online companies with GBP, EUR or USD as their home currency. QuickBooks Desktop is not supported.
Explore QuickBooks Online reportingUK limited companies using GBP as their base currency. Sole traders, partnerships and non-GBP FreeAgent companies are outside the current supported scope.
Explore FreeAgent reportingThe connection reads accounting data. It does not create or update invoices, journals or payments in your accounting platform. Portfolio totals support management reporting; they do not perform statutory consolidation or automatic intercompany eliminations.
Monthly group reporting
Build a GBP Standard management pack from saved reports with verified current and comparative coverage. Check the reporting month, reviewed mappings and warnings before using the figures.
See current-month company columns, combined current and previous totals, and absolute and percentage changes. P&L uses monthly flows; balance sheets use month-end balances.
Review a generated pack, then download the same run as a PDF or a genuine Excel workbook. Dates and warnings travel with the figures.
Save your company selection and optional trial-balance appendix for your own reporting workflow. Reopen a template to select the latest eligible month.
Management reporting before intercompany eliminations and ownership adjustments. It does not provide statutory consolidation.
View and download the fictional sample management packSee the product
An 84-second narrated tour of the actual application using fictional property companies. This tour shows the GBP Xero workflow. QuickBooks Online and FreeAgent now connect to the same reporting workspace; check each provider’s eligibility and setup steps. Follow company selection, profit and loss, balance sheet, mappings and trial balance, with captions available.
Illustrative demo data · Narration and captions · Play when you are ready
Read the accessible transcriptReview the connection steps for Xero, QuickBooks Online and FreeAgent. Xero and QuickBooks Online support GBP, EUR and USD companies; FreeAgent supports UK GBP limited companies. Check dates, mappings and exchange-rate coverage before comparing GBP management reports. The portfolio reporting guide explains the review process, and Xero property reporting covers a Xero-based SPV workflow.
Portfolio dashboards and reviewed account mappings bring profit and loss, balance sheets, and trial balances together.
Choose the companies in your portfolio and review their financial position using saved accounting report data.
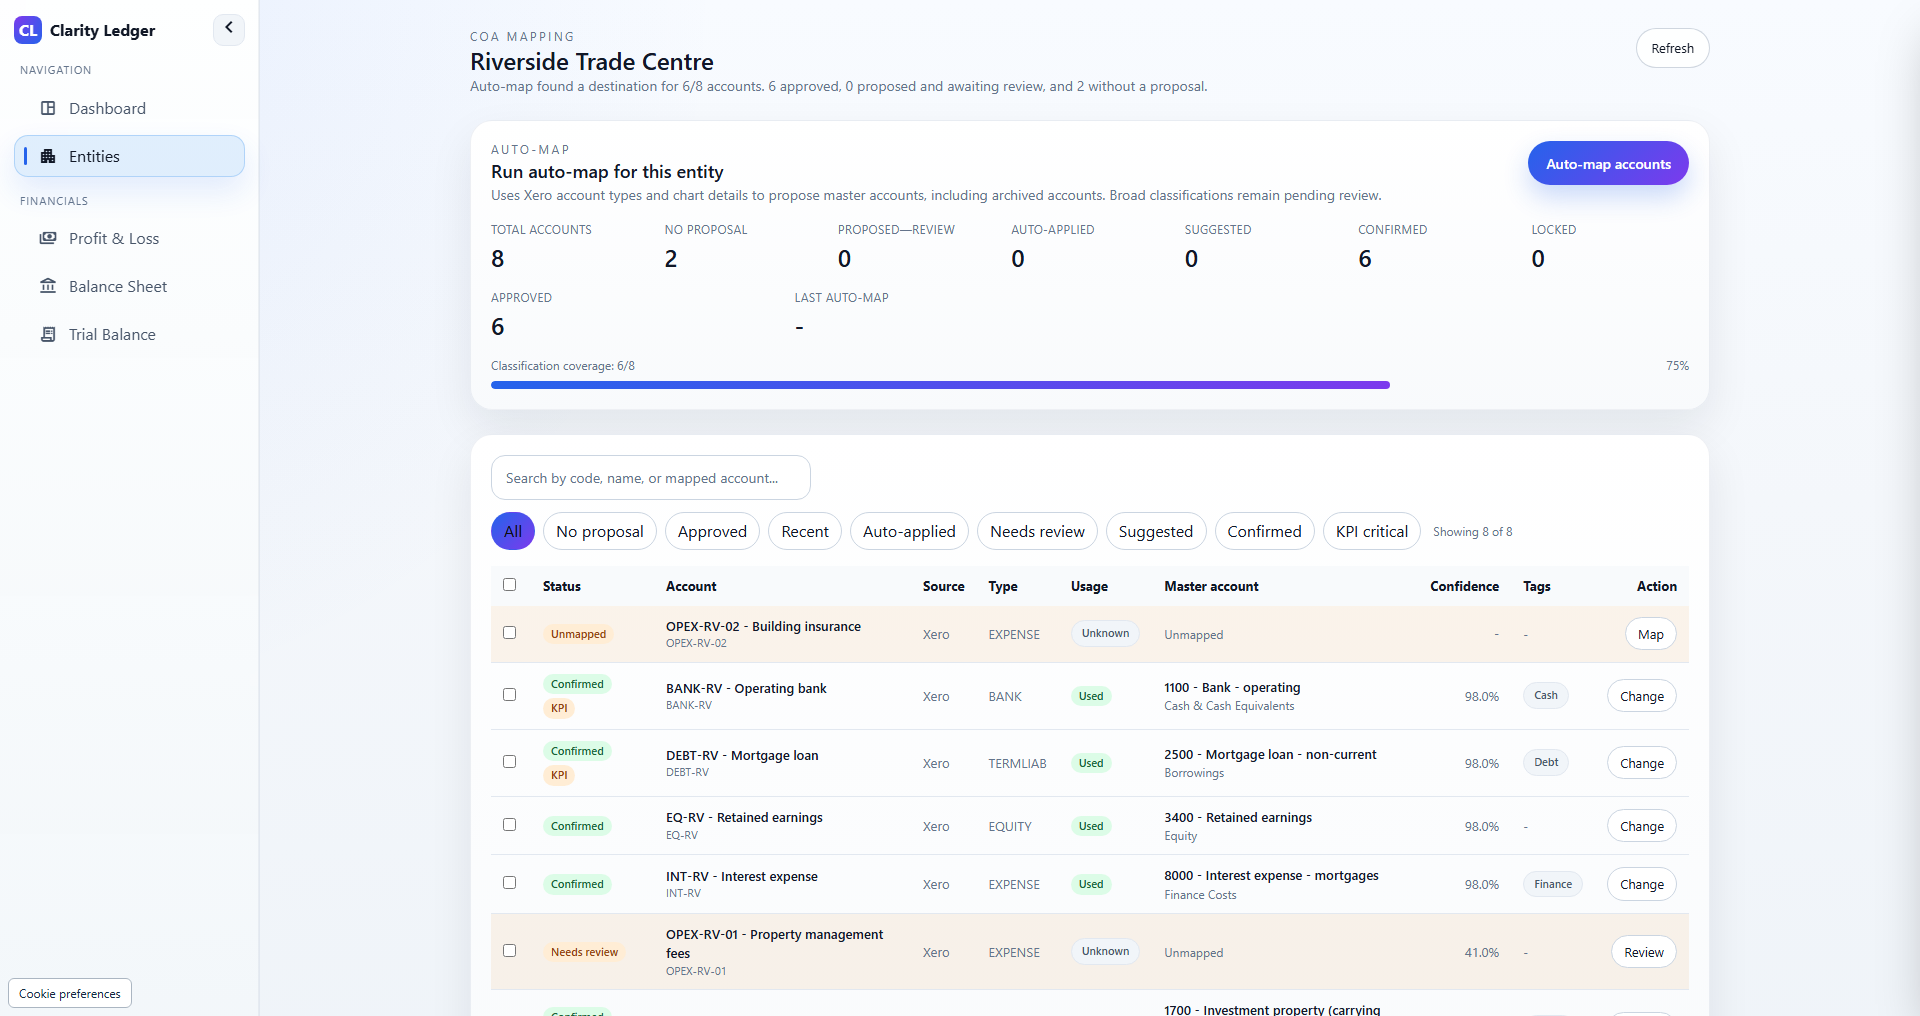
Review each company's account mappings before using Standard reports to compare companies on a common chart.
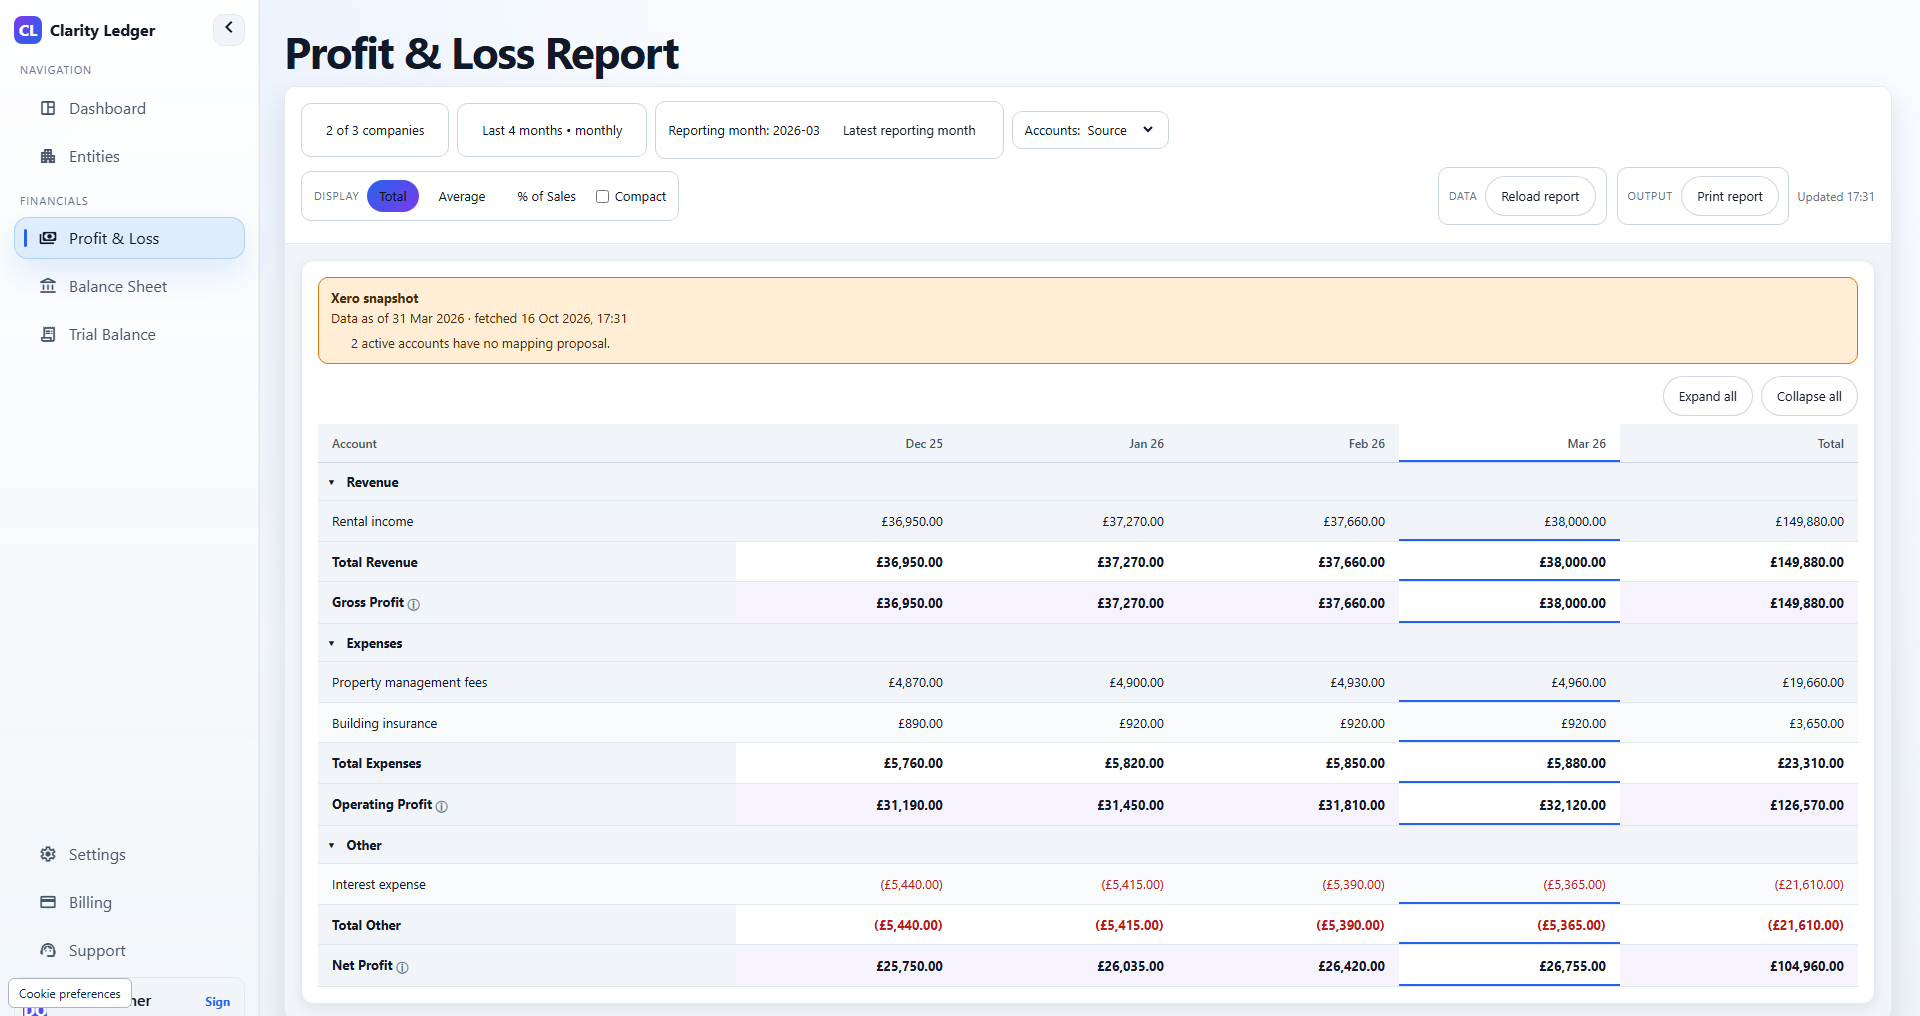
Review revenue, costs, and profit by reporting period in Source or Standard view.
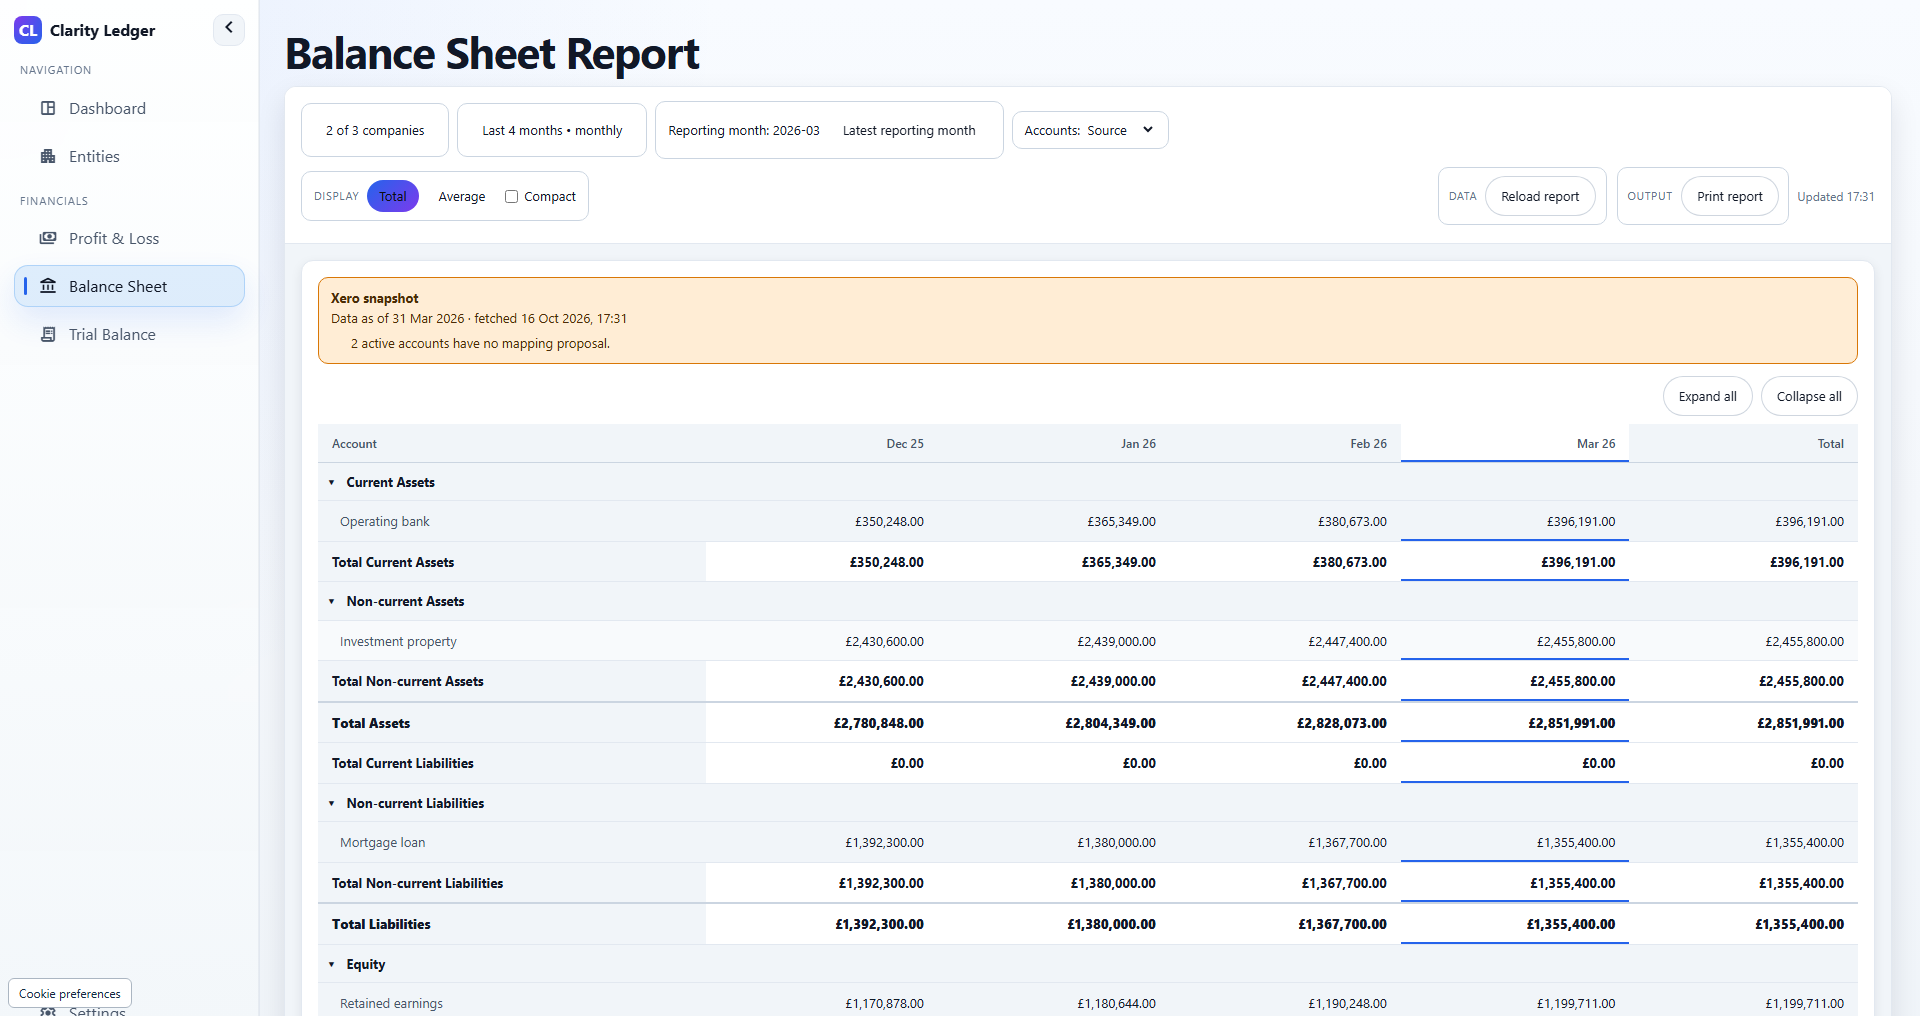
Compare assets, liabilities, and equity for your selected companies and reporting dates.
Inspect Source debit and credit balances, then review Standard net balances and unclassified accounts.
Bring selected companies into one dashboard, with reporting dates and sync status visible alongside the figures.
Map imported accounts to a common reporting chart, with each company's mapping choices available for review.
Compare historical income and expenses across reporting periods and selected companies.
Review assets, liabilities, and equity at the selected reporting dates using saved accounting balances.
Inspect account balances and mapping coverage before using your portfolio reports.
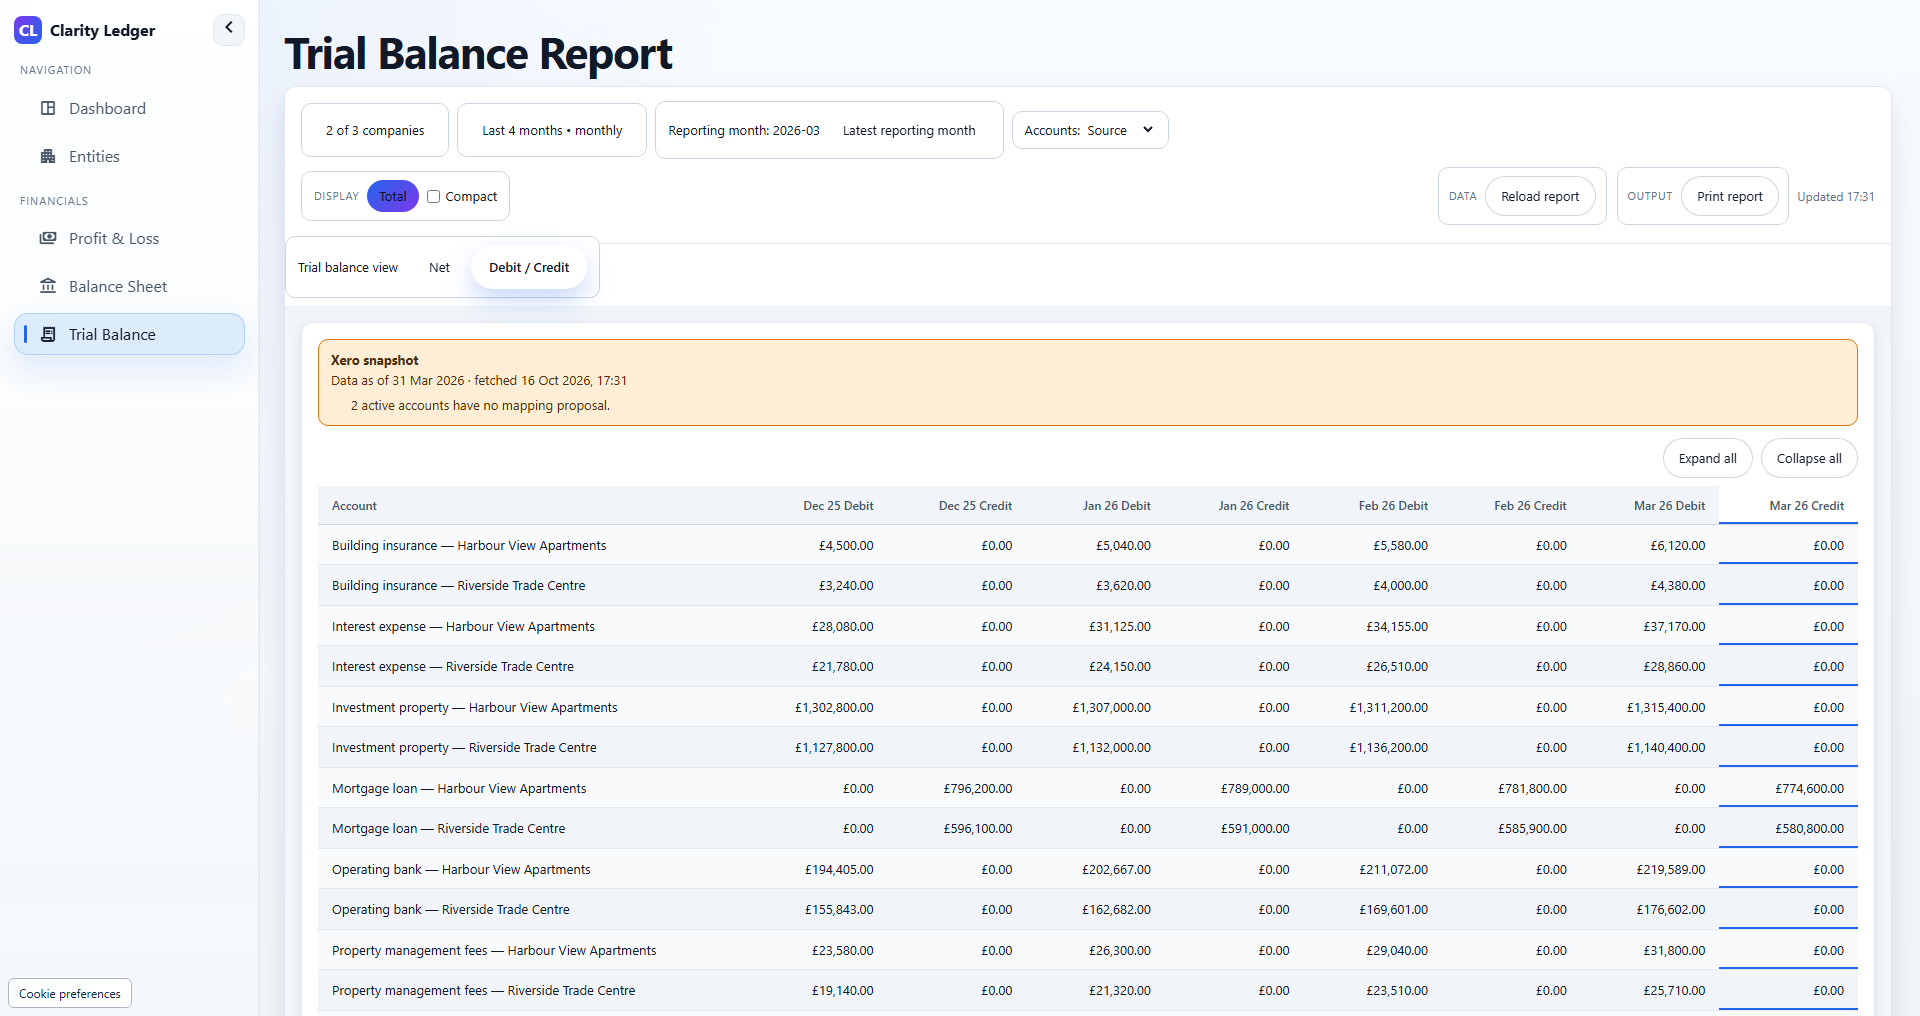
Choose your companies, wait for the first sync, and review account mappings before using Standard reports.
Create an account and complete checkout. Eligible portfolios can receive one 21-day trial.
Authorize Xero, QuickBooks Online or FreeAgent, then confirm the company and destination portfolio. Check provider and currency eligibility before connecting.
Confirming your selection queues the first sync. Check each company's status before opening its reports.
Inspect and apply the mappings you want to use in Standard reports. Review any unmapped accounts.
Open your dashboard, profit and loss, balance sheet, or trial balance. Request a new sync when you need updated figures.
We take a conservative approach to data handling and share a clear security roadmap during onboarding.
Data minimisation and hashed IP storage for leads
Server-side processing for data sources and email
SOC 2-aligned controls and formal audits (roadmap)
Granular access controls and audit logs (roadmap)
Details on integrations, security, and how Clarity Ledger fits into your finance stack.
Frequently asked questions
Built-in clarity on setup, security, integrations, and reporting.
Connect Xero, QuickBooks Online or FreeAgent and review your account mappings and financial reports. A 21-day trial is available once per eligible portfolio.