
Portfolio dashboard design: KPIs, drill-downs, and exceptions that matter
A practical blueprint for a portfolio dashboard that drives decisions: 6-10 real KPIs, consistent drill-downs, and exception-first views-built on standardised SPV roll-ups so "what changed, where, why" is clear in a few clicks.
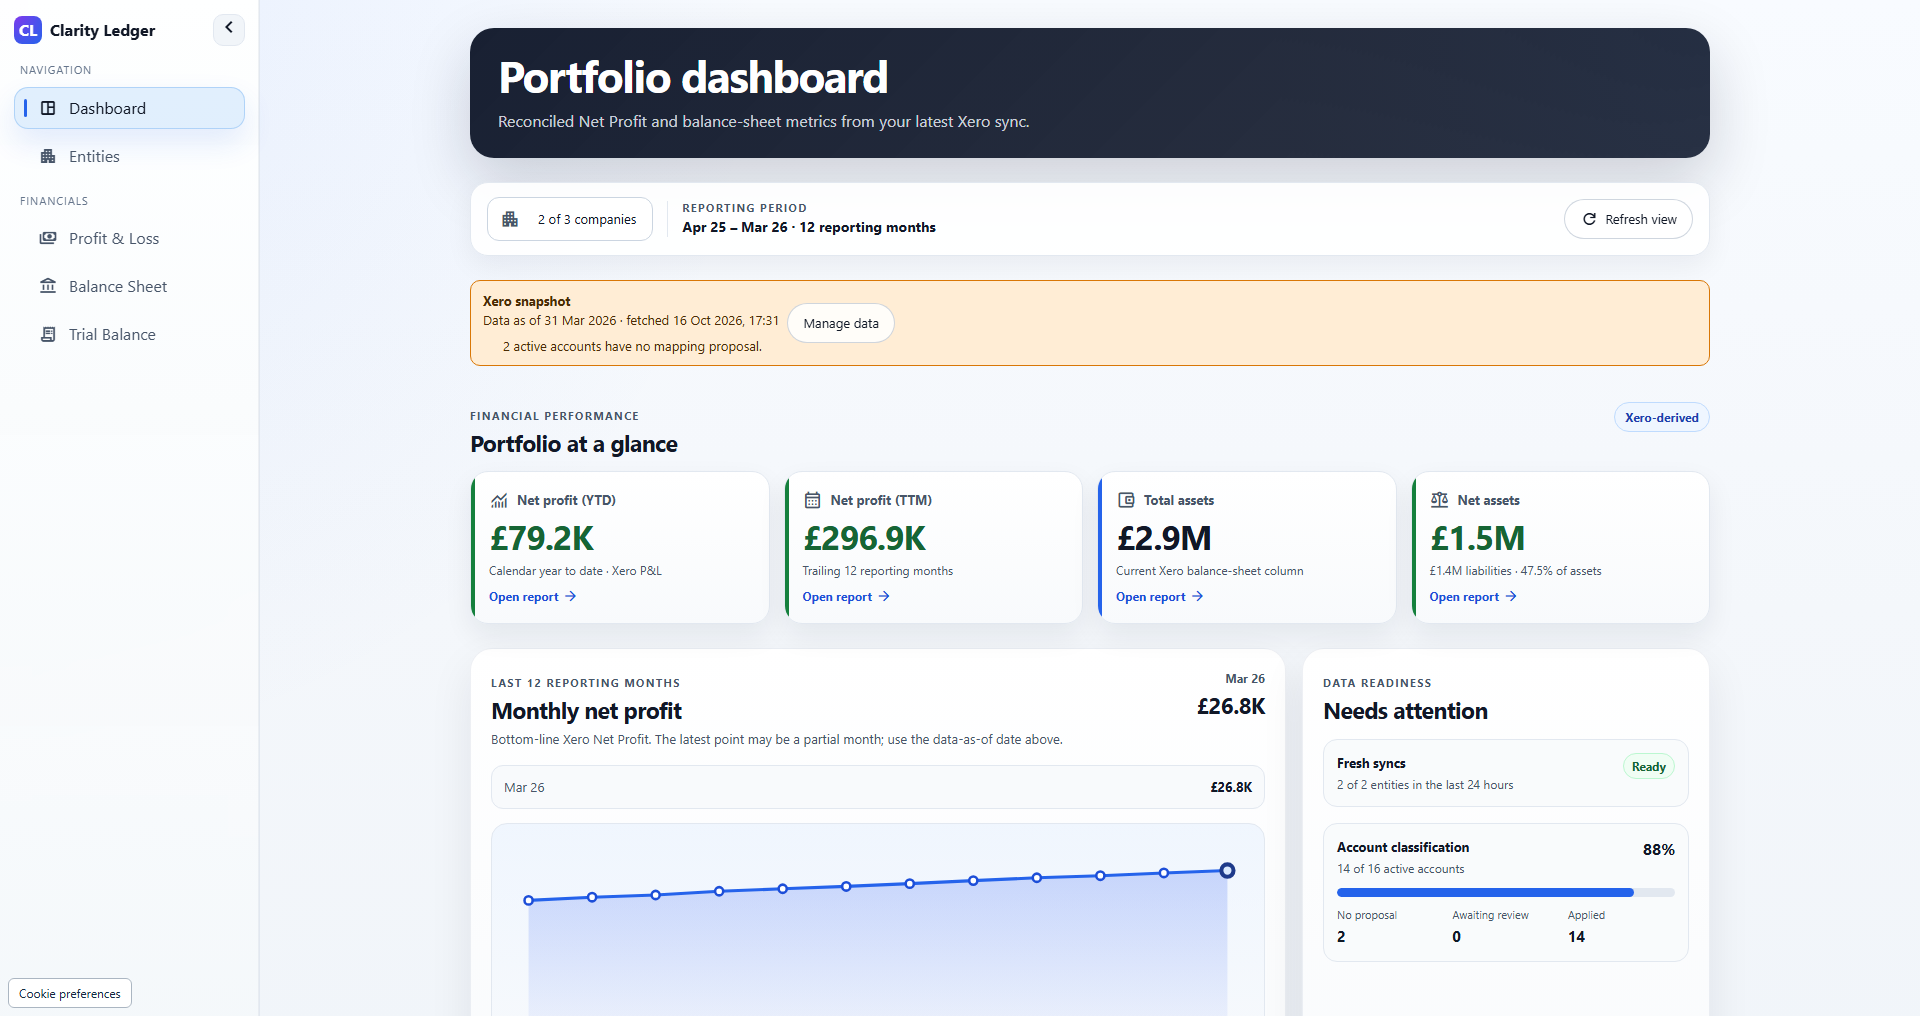
Integration update, 20 October 2026: Clarity Ledger now connects Xero, QuickBooks Online and FreeAgent. GBP Xero examples below remain valid. Check current provider and currency eligibility; planning, KPI and pack-preparation tasks described as manual remain separate workflows.
This is a specification for a wider finance dashboard, not a tour of Clarity Ledger features. Property KPIs, covenant alerts, transaction drill-through and investor packs require separate data, calculations and review; the current product covers historical GBP Xero reports and reviewed mappings.
A portfolio dashboard is not a prettier investor pack. It is an operating tool.
The best dashboards do three things, reliably and fast:
- Show the few KPIs that actually drive decisions
- Let you drill down to the underlying truth in seconds
- Surface exceptions early-so you manage risk before it becomes a fire drill
If your dashboard cannot answer "what changed?", "where?", and "why?" without a spreadsheet detour, it is not a dashboard-it is a slideshow.
Below is a practical blueprint for designing a property portfolio dashboard that scales across many SPVs, stays trusted month after month, and helps finance and asset management act earlier.
Start with the job to be done: decisions, not data
Before picking charts, define the decisions your dashboard should support. In property portfolios, the recurring ones usually fall into five buckets:
- Liquidity: Do we have enough usable cash? Where is it trapped/restricted?
- Performance: Is NOI trending the right way? What is driving variance?
- Operations: Are occupancy, arrears, and lease risk drifting?
- Debt and risk: Are we tightening on covenants, refinancing, rate exposure?
- Capital allocation: Should we fund/slow capex? Are returns progressing as planned?
Every KPI and drill-down should map to one of these decisions. If it does not, it is likely noise.
Design principles that keep dashboards "readable under pressure"
1) One page for "health," then drill-do not cram everything in
Your landing view should answer: "Is the portfolio OK, and what needs attention?"
If someone needs to scroll, you have probably mixed "operating cockpit" with "data library."
2) Make every KPI comparable
A KPI that cannot be compared across assets, SPVs, and time is a trap.
That means:
- standardised definitions (NOI, cash, net debt, occupancy), and
- consistent mapping (SPV accounts -> portfolio reporting lines).
3) Put trend next to today
Snapshot numbers lie by omission. Pair each headline KPI with:
- a 12-24 month trend, or at least a 3-6 month sparkline, and
- variance vs budget/forecast (where available).
4) Build for exception-based review
People do not have time to investigate everything every month.
Dashboards should default to:
- "show me what changed materially," and
- "show me the worst 5 / best 5," not "here is every line."
5) Show definitions right on the dashboard
Dashboards build trust when they are explicit:
- "NOI (definition X)"
- "Cash (unrestricted only)"
- "LTV (valuation date: Sep 2025)"
This prevents meetings turning into definition debates.
The KPI set that works for most property portfolios
A useful dashboard is usually 6-10 headline KPIs with consistent drill-down paths. Here is a battle-tested set.
A) Liquidity and cash reality
1) Unrestricted cash (portfolio + by SPV)
- Why it matters: tells you what is actually deployable.
- Show: unrestricted vs restricted/trapped split.
- Drill-down: portfolio -> SPV -> bank account -> movements.
2) 13-week cash runway / minimum cash buffer breaches
- Why it matters: prevents "surprise" funding moments.
- Show: forecast closing cash by week; highlight weeks below buffer.
- Drill-down: week -> driver categories (rent, debt service, capex, transfers).
B) Operating performance
3) Revenue, OpEx, NOI (with a driver bridge)
- Why it matters: core performance measure investors care about.
- Show: NOI trend + top 3 drivers of month-over-month movement.
- Drill-down: NOI -> asset ranking -> category drivers -> GL accounts.
4) NOI margin (and controllable OpEx ratio)
- Why it matters: shows efficiency and cost pressure without being fooled by revenue mix.
- Show: NOI margin trend; controllable OpEx per unit/sqm where useful.
- Drill-down: OpEx -> categories -> vendor/transaction detail.
C) Operations that predict finance trouble early
5) Physical occupancy vs economic occupancy
- Why it matters: physical can look fine while incentives/arrears erode economics.
- Show: both metrics side-by-side; add "offline units/area" line if refurb is active.
- Drill-down: asset -> occupancy type -> unit/space cohort.
6) Collections rate + arrears aging
- Why it matters: it is how NOI turns into a cash problem.
- Show: collections % + arrears aging buckets (0-30/31-60/61-90/90+).
- Drill-down: asset -> tenant concentration -> delinquent list.
D) Debt and portfolio risk
7) Net debt and LTV (with valuation date clearly labeled)
- Why it matters: leverage risk and covenant direction.
- Show: gross debt, net debt (subtract usable cash only), LTV and net LTV.
- Drill-down: facility/SPV -> maturity -> valuation basis -> headroom.
8) DSCR/ICR headroom (facility-level first)
- Why it matters: covenants break at facility/SPV level, not at blended portfolio averages.
- Show: covenant limit line + headroom trend.
- Drill-down: facility -> NOI definition used for covenant -> drivers.
E) Capex and value creation
9) Capex: spent vs committed vs budget
- Why it matters: committed capex predicts cash troughs earlier than "spent."
- Show: spent YTD + committed pipeline; timing of next 4-8 weeks.
- Drill-down: programme/cohort -> invoices/POs -> funding source.
10) Capital returned / distribution capacity (if relevant)
- Why it matters: ties performance back to investor outcomes.
- Show: equity deployed vs returned; distribution constraints (cash traps, lender sweeps).
- Drill-down: SPV -> restriction reason -> release conditions.
Minimum viable tip: if you are early, start with 6 KPIs (cash, NOI, occupancy, arrears, LTV, capex committed). Add the rest once those are stable.
Drill-downs that matter: the "three clicks to truth" rule
A dashboard earns trust when any number can be validated quickly.
A practical standard is:
Portfolio -> Asset/SPV -> Driver -> Source
Examples:
"NOI is down" drill path
- Portfolio NOI decreases
- Asset ranking shows Asset C is the main driver
- Asset C driver view shows "Repairs and Maintenance" increasing
- Click into GL accounts -> top vendors/transactions -> invoice notes
"Cash is fine... right?" drill path
- Portfolio cash shows GBP X
- Split view reveals only GBP Y is unrestricted
- SPV breakdown shows cash concentrated in SPV A
- Restriction detail shows DSRA / lender sweep rules (cash trapped)
"Occupancy is stable but revenue fell" drill path
- Occupancy chart stable
- Economic occupancy down (or collections down)
- Drill to rent roll / arrears
- Identify incentives/rent-free, delinquent tenants, or downtime cohort
Design note: drill-downs should be consistent across KPIs. Users should not have to "learn" a new navigation pattern for every chart.
Exceptions that matter: stop reviewing everything
The biggest dashboard upgrade is not a new chart-it is a smarter default.
What to include in an "Exceptions" panel
Think of this as your finance team's watchlist:
- Top 5 unfavorable variances (month and YTD)
- Top 5 improving metrics (so you do not miss good news)
- New breaches (minimum cash buffer, DSCR headroom, arrears threshold)
- Deteriorating trends (2-3 periods in a row)
- Data completeness warnings (SPVs missing/estimated, stale bank recs)
The exception rules that work in practice
Use a mix of absolute and relative thresholds:
- Variance triggers:
> GBP Xand/or> Y% - Trend triggers: "worsened 2 months in a row"
- Concentration triggers: "top 3 tenants account for more than Z% of arrears"
- Liquidity triggers:
< N weeks runwayor "below minimum buffer" - Covenant triggers:
headroom < buffer(for example,<0.20xDSCR headroom)
Important: avoid vague RAG (red/amber/green) without definitions. If it is red, it should be red for a reason everyone agrees on.
The hidden foundation: why dashboards break in multi-SPV portfolios
Most portfolio dashboards disappoint for one reason:
The dashboard is built on inconsistent roll-ups.
Across many SPVs, you typically have:
- different charts of accounts,
- inconsistent coding (capex vs opex, one-offs),
- different close timelines,
- cash sitting in many bank accounts with restrictions.
The fix is a portfolio layer that standardises and consolidates first, then visualises. For example:
- a one-stop view across multiple SPVs,
- standardised chart of accounts and mappings so roll-ups are consistent,
- and FP&A capabilities (forecasting, cash flow planning, scenarios) that sit on top.
When the roll-up logic is stable, dashboard design becomes simple. When it is not, the dashboard becomes an argument generator.
A practical "build order" that avoids dashboard theatre
If you are building (or rebuilding) a portfolio dashboard, this sequence works well:
Step 1: Lock definitions and mapping
- Define NOI, cash (unrestricted/restricted), occupancy types, net debt/LTV.
- Map SPV accounts to standard portfolio reporting lines.
Step 2: Ship a minimum viable dashboard
- 6 KPIs + an exceptions panel
- Portfolio -> asset/SPV drill-down
- Clear "as of" dates and completeness flags
Step 3: Add scenario and forecasting views
- 13-week cash forecast
- interest rate and occupancy sensitivity
- refurb programme downtime/capex/payback
Step 4: Add narrative and workflow
- automated commentary drafts ("what changed", "risks to watch")
- approvals and audit trail for investor/board outputs
Common dashboard mistakes (and what to do instead)
Mistake: 30 KPIs on one screen
Do instead: 6-10 headline KPIs + exceptions + drill-down library.
Mistake: Portfolio averages only
Do instead: show dispersion (top/bottom assets) and facility-level covenant views.
Mistake: "Cash" without restrictions
Do instead: always split unrestricted vs restricted/trapped.
Mistake: Occupancy without economic reality
Do instead: physical + economic occupancy + collections/arrears.
Mistake: Beautiful charts, unclear logic
Do instead: display definitions, valuation dates, and data completeness status.
Closing thought: the best dashboards reduce meetings, not add them
A good portfolio dashboard does not just report performance-it changes behaviour:
- less time compiling numbers,
- faster root-cause analysis,
- earlier action on exceptions,
- more credible investor communication.
If your dashboard can answer "what changed, where, and why" in a few clicks-and default to exceptions-you have built something the business will actually use.
More operations insights for real estate finance teams.
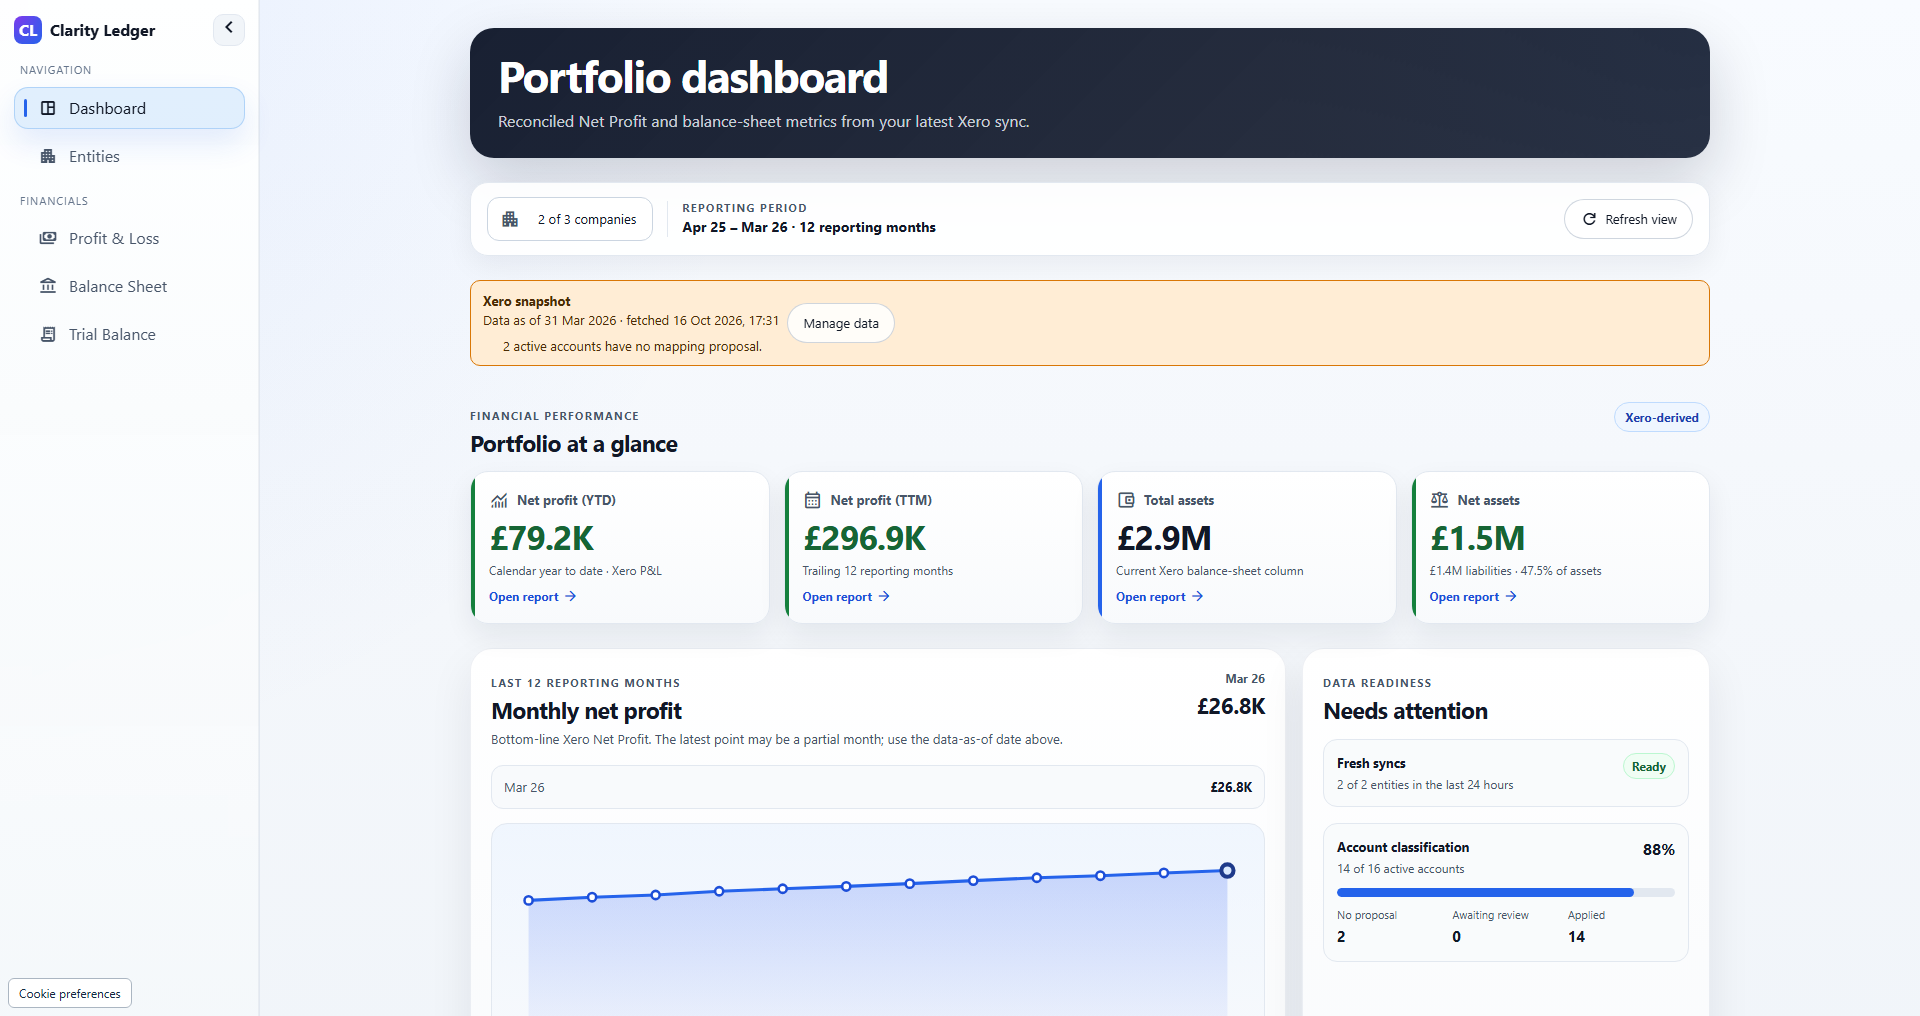
Actual Clarity Ledger portfolio dashboard · Illustrative demo data
Release notes that matter: what changed and why it helps finance teams
A finance-grade release note template that answers what changed, who is affected, why it matters, what to do, and how to validate-so multi-entity teams keep reconciliations, definitions, and trust intact.
Actual Clarity Ledger portfolio dashboard · Illustrative demo data
From raw accounting data to investor KPIs: a manual reporting framework
A manual investor KPI framework: align SPV inputs, document mappings and roll-up rules, calculate metrics separately, and reconcile outputs to evidence.
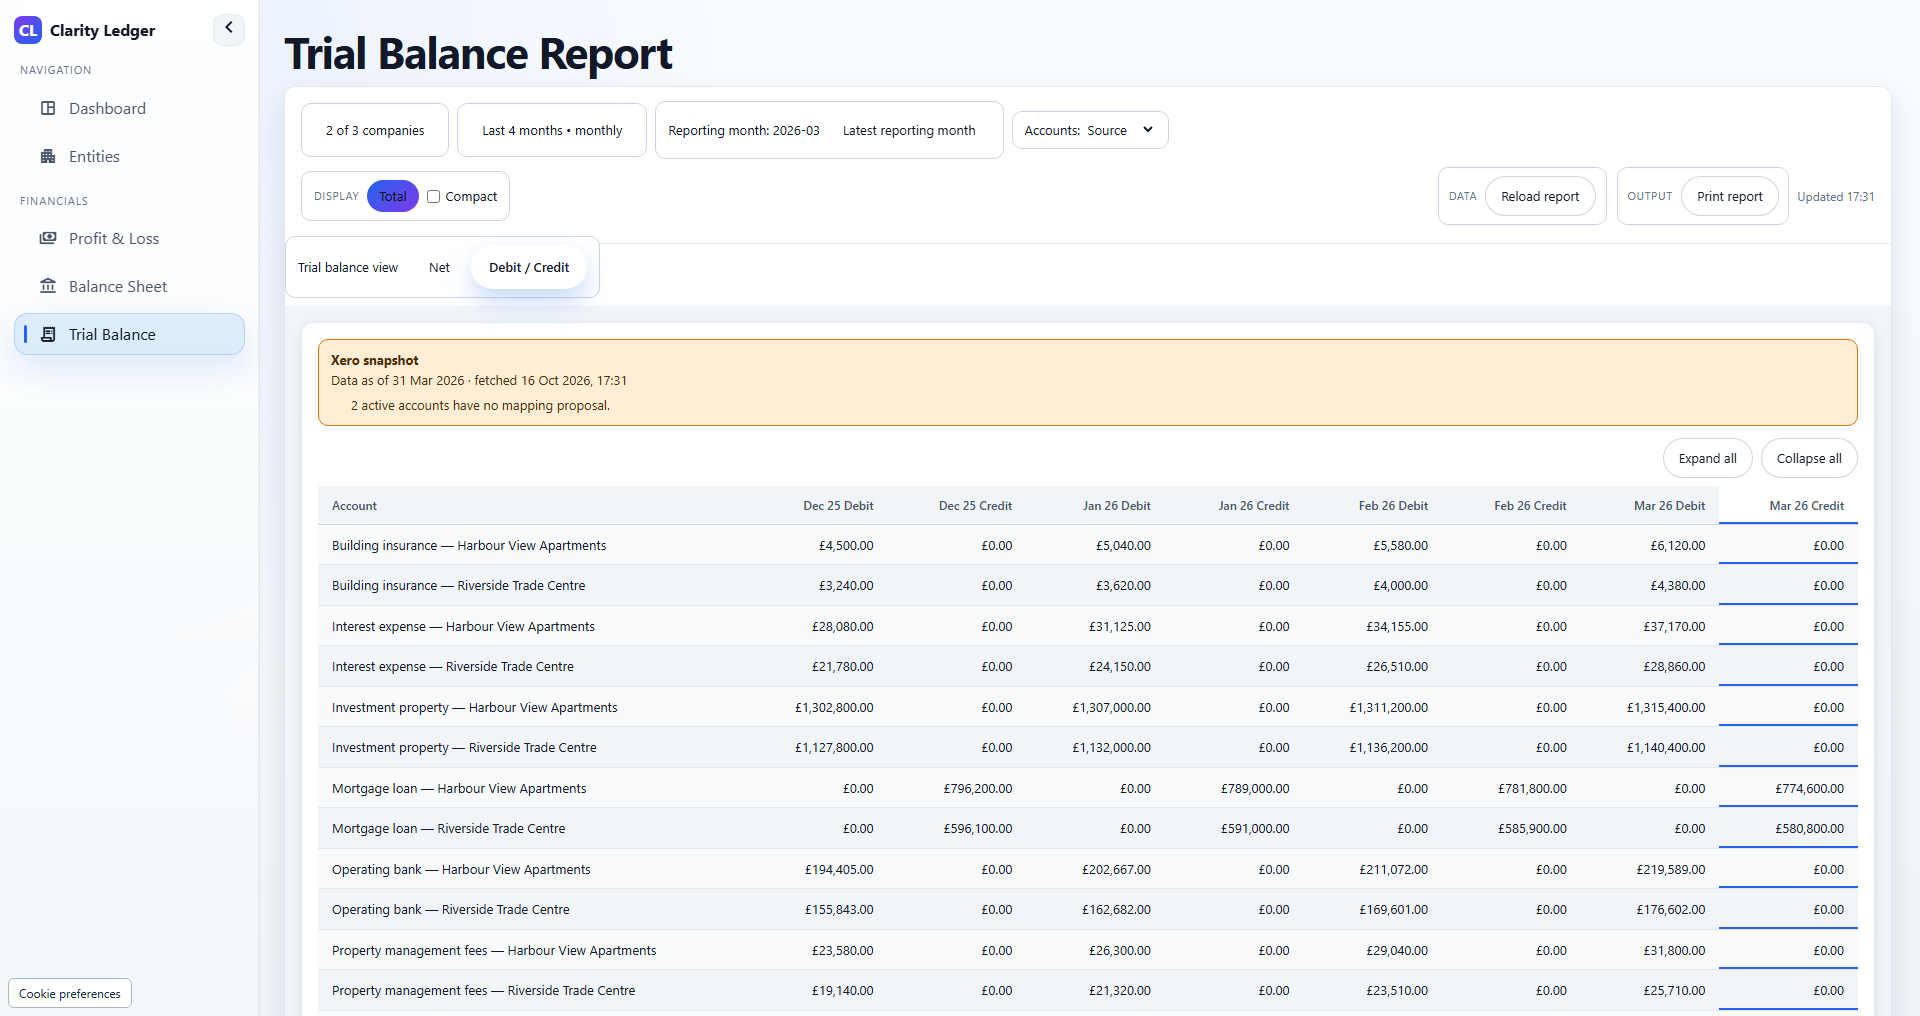
Actual Clarity Ledger trial balance report · Illustrative demo data
A month-end close checklist for property SPVs
Practical, evidence-based close routine for rent-led SPVs-cash, rent roll tie-outs, service charge, capex vs opex, debt and covenants-plus a downloadable PDF checklist you can use this month.
Ready for portfolio-grade reporting?
Review Xero, QuickBooks Online and FreeAgent companies in one dashboard, with saved financial reports and account mappings you apply. A 21-day trial is available once per eligible portfolio.